


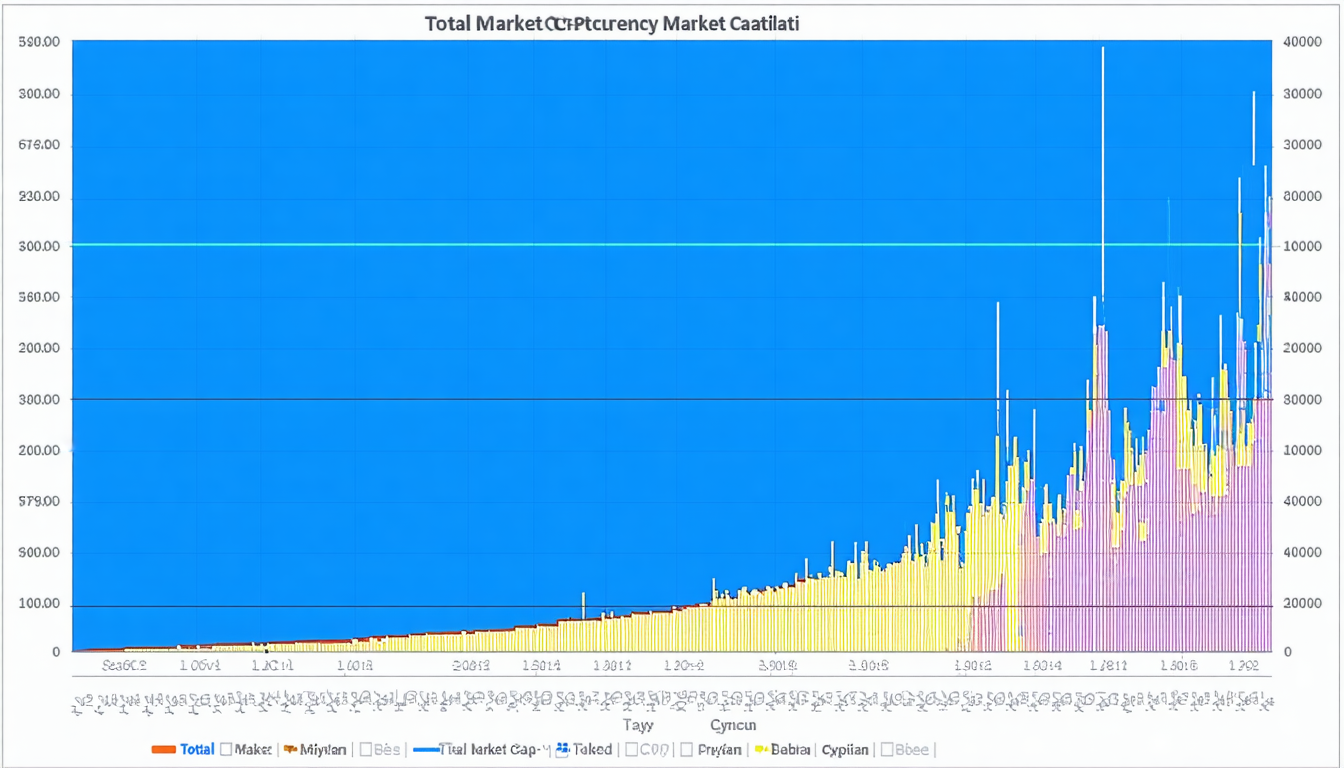
Stepping into early 2026, the total cryptocurrency market capitalization hovers in the $3.1 to $3.13 trillion range. Platforms like CoinGecko report approximately $3.48 trillion, though timelines vary and real-time volatility suggests that a figure around $3.13 trillion is more precise as of January 20, 2026 (en.macromicro.me). This nuance matters—depending on data source and timestamp, the “total market cap” can shift by a few hundred billion in just days.
Why This Matters: Interpreting Market Cap Signals
Beyond raw figures, total market cap serves as a barometer of market sentiment. When it rises, there's often renewed confidence, inflows of capital, and perception of growth. Conversely, retrenchment prompts talk of corrections or broader bear phases. It’s not black-and-white—but it’s often in the headlines.
Market Cap as Sentiment Gauge
Beyond the numbers, what truly matters is the trajectory—steady climb signals stability and investor confidence; sharp dips could hint at profit-taking or macro headwinds. In practice, total market cap offers a snapshot of where the industry collectively stands.
Structural Breakdown: What Influences Total Market Cap
Leading Assets Steer the Ship
Leading cryptocurrencies—Bitcoin and Ethereum—account for a lion’s share of the total, often exceeding 60% combined. Their performance can tilt the entire market cap in meaningful ways. If these major players rally, smaller tokens often follow; if they dip, contagion can follow, even among unrelated projects.
Altcoins and Emerging Sectors Add Color
While majors dominate, altcoins—especially those tied to AI, DeFi, RWA (real-world assets), meme culture—can punch above their weight. Surge of interest in AI-linked tokens or real-world asset protocols, for instance, can propel parts of the market, even if total cap fluctuates.
Trading Volume and Market Health
Daily trading volume—hovering in the low hundreds of billions—helps validate moves. High cap but low volume can suggest stale markets; high volume with rising cap signals active participation and confidence.
Navigating the Data: Real-World Example
Imagine a scenario: total cap edges toward $3.13 trillion amid healthy trading volume and Bitcoin dominance stabilizing around mid-to-high 50%s. At the same time, Ethereum is holding steady in the low $3,300s, and AI-linked altcoins are seeing incremental gains. This tells us that while the market isn’t booming, there’s balanced engagement across layers—majors holding ground and niche players creating texture.
This also hints that these gains are broad-based rather than shallow pumps—trustworthy if subtle. In times like this, the narrative often shifts to metrics like liquidity—whether capital lies frozen or flowing across sectors.
Expert Insight
"When total market cap hovers near the $3.1–3.2 trillion mark amid steady volumes, it's neither exuberance nor collapse—it’s the market catching its breath, consolidating before the next act."
This highlights how cap doesn’t have to break records to signal health; sometimes stability is the signal.
Strategic Implications for Stakeholders
Investors and Traders
A steady total market cap suggests measured risk. Diversifying across sector leaders and promising niches may offer balance. Watch daily volume trends—if they rise alongside cap, that’s encouraging. If cap flattens but volume spikes, double-check whether it's redistribution rather than growth.
Industry Observers and Analysts
Total market cap offers broad context. But drilling into subsectors—AI-linked tokens, RWA protocols—can reveal growth pockets that may not yet move the aggregate. It’s a complementary lens, not a replacement for asset-level insight.
Media and Communicators
Presenting total cap with qualifiers (e.g. “hovering around $3.1 trillion”) offers authority without implying false precision. Pivoting from that figure to stories about sector strength or volume shifts helps readers grasp deeper trends.
Key Takeaways
- Total crypto market cap today is approximately $3.1–3.13 trillion, though high-frequency data like CoinGecko’s $3.48 trillion reflects faster-moving snapshots (en.macromicro.me).
- This metric shades more than shapes: it captures sentiment, liquidity, and macro trends without being a lone indicator.
- Bitcoin and Ethereum remain critical bellwethers; their stability or volatility colors cap movements.
- Healthy market periods often show stable cap accompanied by robust trading volume—signaling engagement rather than speculative heat.
- Watching sector-specific trends (AI, DeFi, memes, etc.) complements total cap, uncovering the nuanced stories beneath the broader headline.
In essence, total market cap isn’t just a number—it’s a frame. It orients us to where crypto markets stand, and when paired with volume, sector trends, and asset-level data, it helps clarify whether the market is truly coiled or simply catching a breath.


Leave a comment