


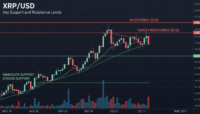
In the fluid world of crypto technicals, XRP/USD currently sits in a zone of careful tension—markets seem locked between accumulation at lower bounds and supply overhead. On one hand, traders watching sessions from early 2026 observe a consolidation in the roughly $1.80–$1.90 corridor—“a clear box,” as one analyst aptly terms it—with repeated tests of both the floor (accumulation zone) and ceiling (supply zone) .
Meanwhile, broader technical frameworks point to resistance stacked above. Retail and institutional sentiment arises slowly; the 50-day and 200-day EMAs hover above current price, establishing hierarchy that favors bears unless breached decisively .
This sets the context: XRP is consolidating, oscillating between defined ranges, with the upward path littered with technical hurdles and the downside guarded—but not impossible.
Key Support Zones to Monitor
1. $1.80–$1.85: The Immediate Floor
This band has consistently drawn buying pressure and short-covering. Tests around $1.80 repeatedly see buyers step in . A break below that could open the door for more notable declines.
2. $1.77–$1.80: Structural Integrity Line
Viewed as the structural "line in the sand," this mid-range level has held firm since late 2025. A sustained daily or weekly close below it would invalidate core bullish narratives and potentially usher in pressures toward the mid-$1.60s .
3. $1.60–$1.61: Bearish Extension Target
If that structural support fails, technical extensions point toward the October 2025 flash-crash low near $1.61, and in extreme cases a further stretch toward $1.26 has been mapped—though such moves hinge on poor broader markets and crypto risk aversion .
Resistance Landmarks and Upside Potential
1. $1.97–$2.05: Short-Term Resistance Band
Reclaiming this zone would compress range-bound tension and signal a tactical shift. It forms the first rung in a ladder of upside, especially with improving volume .
2. $2.05–$2.35: Mid-Term Ceiling
A more formidable cap, this combines the 20-day and 50-day EMAs and has repeatedly capped upside since late 2025 .
3. $2.30–$2.50: Critical Break Zone
This range aligns with the 200-day EMA and prior consolidation highs. A clean breakout here could flip the medium-term outlook bullish .
4. $3.00–$3.30: Structural Objective
Above $2.50, technical structures like inverse head-and-shoulders and neckline projections target the $3.30–$3.50 zone . Reaching this would depend on flow upside, renewed momentum, and macro tailwinds.
Broader Technical Themes and Market Signals
- Divergence Clues: Some RSI-driven bullish divergences have popped up near support zones, hinting at waning seller strength .
- Whale Behavior: Recent on-chain data reveals large holders reducing exposure—possibly locking gains or redistributing. That’s tricky—on one hand it eases pressure; on the other, sellers may absorb rallies .
- ETF Inflows as Wildcard: A populist thesis argues that sustained $10 billion in ETF-backed demand could dramatically tighten circulating supply, potentially scaling XRP toward $5–$8 in optimistic scenarios .
Human Insight and Quote
"If XRP can defend the $1.85 area and break above $2.10 with conviction, it's no longer consolidation—but a medium-term pivot."
This captures the numbing tightness in the tape right now—traders are waiting for clarity, not guessing. And crypto markets notoriously break only after long periods of indecision.
Summary Table of Crucial Levels
- Support:
- $1.80–$1.85 – short-term accumulation zone
- $1.77–$1.80 – structural support; breakdown invalidates bullish base
-
$1.61 – low-probability but possible collapse target if markets deteriorate
-
Resistance:
- $1.97–$2.05 – tactical reclaim zone
- $2.30–$2.50 – major barrier with structural implications
- $3.00–$3.30+ – upside ambition if breakout gains legs
Closing Thoughts
XRP/USD currently oscillates in a defined range, balancing between accumulation below $1.90 and supply around $2.35. A break above $2.05–$2.30 could ignite a broader rally toward $3, while a failure under $1.77 could target deeper corrections near $1.60. Traders and holders should track volume, EMA alignment, ETF flows, and on-chain whale activity to gauge the next leg. The tape is coiled—and a clear directional nudge is all that’s needed.
FAQs
What makes the $1.85–$1.90 zone significant for XRP?
This band has acted as a reliable floor in early 2026, attracting accumulation and short-covering. It sets the immediate line between neutral bias and downside risk .
Why is reclaiming $2.05 important for trend reversal?
It sits at the edge of shorter-term EMAs and underpins an initial pivot from range-bound action to a more constructive setup. Volume-backed moves above this level could unlock higher resistance zones .
If $1.77 breaks, how far could XRP fall?
A break below that level risks a drop toward $1.61—a flash-crash low—or even lower toward $1.26 in an extreme risk-off scenario .
Could ETF inflows change the narrative?
Yes—promised inflows of billions into XRP ETFs could contract supply materially, potentially targeting $5–$8 upside in optimistic models, though this relies heavily on sustained demand and macro support .
What’s the outlook if XRP breaches $2.50?
Clearing that zone would flip the medium-term structure bullish, setting scope for runs toward $3.00–$3.30, especially if technical patterns and momentum indicators align .
How should traders approach risk at current levels?
Given the asymmetry—limited upside nearby versus deeper downside risk—a cautious bias is warranted. Holding existing positions is reasonable, while new entries may wait for clear breakouts above $2.10 or capitulation into the mid-$1.40s .
This analysis weaves technical clarity with narrative insight, helping investors anticipate XRP’s next move amid evolving market structure.


Leave a comment