


Trading BTC/USDT can feel like riding a roller coaster without a safety bar—thrilling, nerve-wracking, and confusing if you’re not strapped in the right way. For many traders, the promise of maximum profit seems always just out of reach. Yet, with a strategic framework, grounded tactics, and flexible mindset, it’s possible to tilt the odds in your favor. This piece delves into a trading strategy for the BTC/USDT pair that balances technical rigor with human unpredictability—like the way actual traders might stumble forward, learn, adapt, and exhale when they finally catch a trend.
This feels like more than just a tutorial. It's a sort of conversation—some educated, some scratch-your-head moments, some “ah-ha” revelations. No pretending it's flawless or algorithmic perfection, because crypto markets rarely are. But if you’re seeking a path towards consistent gains, this is meant for you.
Understanding BTC/USDT Dynamics
Volatility as Opportunity, Not Just Risk
Bitcoin paired with USDT (a stablecoin pegged to the dollar) is notorious for wild swings. Many traders see this as risk, and well, it is—but also opportunity. Volatility can mean big moves and, if timed right, significant profits. But that timing is tricky.
“Volatility is just a high-voltage wire. Handle it with proper insulation, and you have power.”
To ride that, you need:
- A solid volatility measurement (like ATR or Bollinger Bands).
- A plan for entry, exit, and stops.
- Emotional awareness—as volatility doesn’t wait for mood swings to settle.
Liquidity and Market Structure Clues
USDT pairing typically offers deep liquidity on major exchanges. That means tighter spreads and less slippage, essential for executing swift entries and exits. Yet, it also means big players can push price with less notice than you'd like.
Look at:
- Order book imbalances.
- Large trades or “whales” moving price.
- Time-of-day patterns (e.g., lock in or close during overlap of U.S./Asia sessions).
This is not just textbook—they matter in practice. You see a big wall north of price, you might suspect resistance; you see it vanish, it informs real-time decisions.
Core Strategy Framework
1. Trend Identification and Confirmation
First off, skip trying to catch every dip or bounce. Agree? Good. Instead, focus on what’s already demonstrated trend—on, say, the 4-hour and daily charts.
Use a mix like:
- 20 and 50 EMA crossovers for trend direction.
- Price action confirmation: higher highs and lows for uptrend; lower highs/lows for downtrend.
When both timeframes align, that’s your “trend zone.” Buying against it? Well, only if there’s a solid reversal signal—and yes, even reversals can fizzle out. Better to leverage the stronger tide.
2. Entry Tactics: Patience Meets Precision
After trend alignment, wait for price to pull back into a high-probability zone. We’re talking retracements to a confluence:
- Fib 50–61.8% level.
- A previous swing high or low.
- Dynamic support/resistance (like the 50 EMA).
Then, look for confirmation via:
- A bullish/bearish pin bar or engulfing candle.
- Volume surge (relative to recent) indicating conviction.
That’s your entry sweet spot. Not perfect, but it’s a focused, tactical approach that merges setup with evidence of turning.
3. Risk Management: The Non-Negotiable
This may sound textbook—but trading without risk discipline is like jumping out of a plane without a parachute.
- Risk only a small percentage per trade (e.g., 1–2% of account).
- Set your stop just outside the structure zone—beyond the swing high or recent auction point.
- Use position sizing tailored to ATR—wider ATR, smaller size, tighter ATR, more flexibility.
Sometimes, people over-optimize ex-ante and slack in-the-moment. Don’t. Protect your capital before thinking about profits.
4. Scaling Out & Profit Management
If you’re aiming for “maximum profit” you need control. Consider:
- Scaling out in two portions—first at 1:1 or 1.5:1 reward-to-risk, then trailing stop with second.
- Or, use a trailing stop (like 50 EMA or recent swing) to let the trend run naturally.
Choosing between claimed simplicity and flexibility depends on personal style. Some like scheduled take-profits; others want to ride momentum. Both can work, as long as you’re aware of trade-offs: fixed targets can cap wins, while trailing stops can get you stopped just before a big move resumes.
5. Monitoring and Adaptation
Beyond entering and exiting, the real work is in monitoring and adjusting:
- Watch macro catalysts: halving events, regulation news, exchange outages.
- Be ready to tighten stops or bail early if structure breaks.
- Trade plan, yes—but real markets may ask for real-time judgment calls.
It's a balance: plan ahead, but stay alert and adaptive.
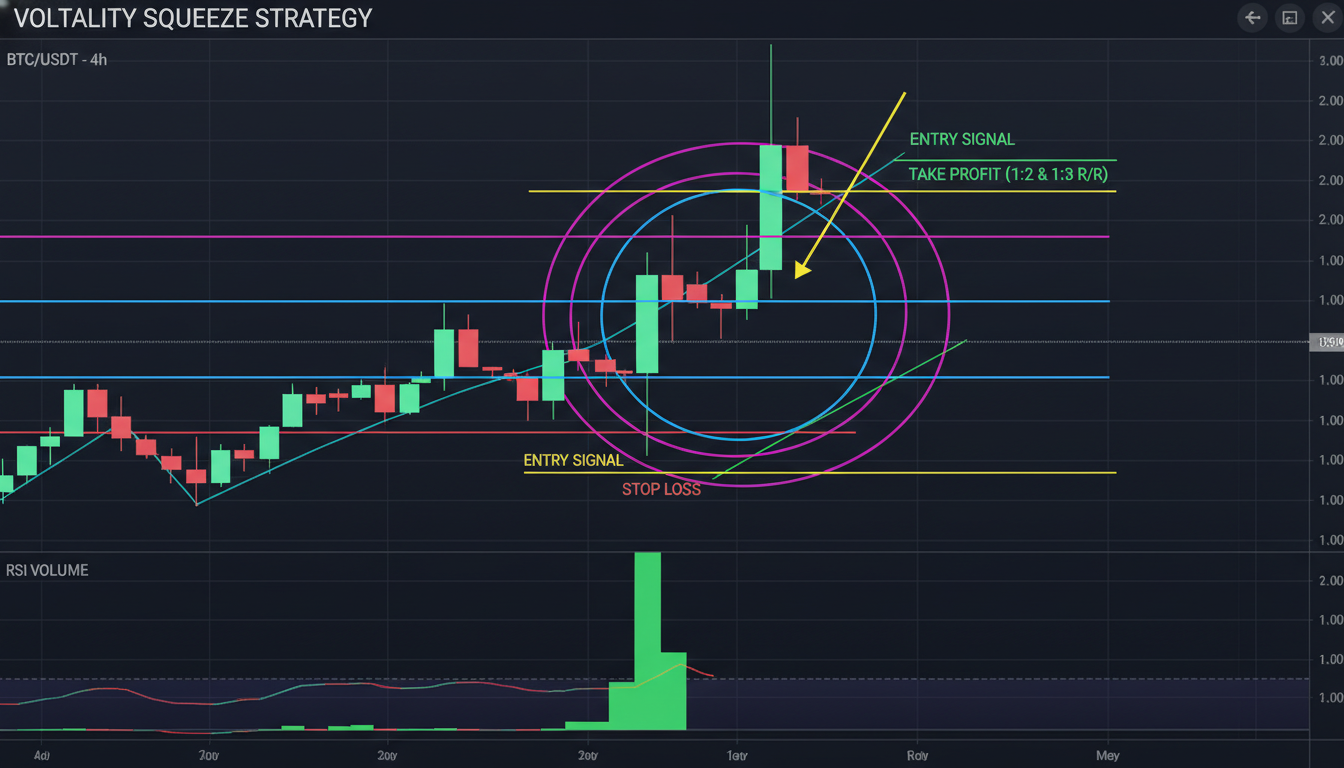
Mini Case Study: A Realistic Scenario
Imagine BTC in a clear uptrend on daily and 4-hour chart. Price retraces to the 61.8% Fibonacci level, which also aligns with the 50 EMA. You see a bullish engulfing candle and a modest increase in volume (not a rocket spike, just noticeable).
You enter a long position. Stop is placed just below recent swing low. Risking 1%. Price hits 1:1, you take half off, rest now trailing behind 50 EMA. Then, macro news hits—like a big institutional buy, and BTC surges. Your trailing stop catches some of it, and final exit nets you a decent return.
That’s not a fairy tale—but an archetype built from real market behavior. Sure, the numbers vary, but you see the structure: align trend, enter smart, manage risk, adapt as needed.
Tools and Signals You Might Use
Technical Indicators You Might Lean On
- EMA crossover alerts on 4-hour/daily.
- Volume heatmaps showing trade clusters.
- ATR-based position-size calculators.
- Heatmap or footprint charts showing order flow (for more advanced traders).
These aren’t unicorns—they’re accessible and useful. Just don’t overload your screen—simplicity often helps clarity.
Data Sources and News Feeds
Again, fundamentals creep back. Watch for large wallet movements (on-chain alerts), regulatory news, or exchange-level developments (like a listing or outage). Combine technical triggers with real-world context.
A headline might derail your technical setup—or confirm it. Reading the market’s mood enhances your precision.
Psychological Resilience: The Often Overlooked Edge
You can build the most logical strategy, but if your nerves tangle—or greed sets in—you’ll wreck it. A few reminders:
- Expect drawdowns. It’s normal to have a few losing trades in a row.
- Keep a trade journal—not just the trade details, but your emotion, why you entered, what you felt on exit.
- Review regularly. Patterns emerge—not only in price, but in your reactions.
"Your psychology often plays the loudest signals—not the chart."
Embrace humanness. You won’t be robotic. The secret is not to deny emotions, but to manage them with clarity.
Strengths and Limitations of This Strategy
Why It Works
- Aligns with macro trend—cuts noise.
- Focuses on high-probability retracements.
- Solid risk discipline prevents ruin.
- Combines technical with news and behavior awareness.
Where It Might Falter
- Sudden exogenous moves (like exchange hacks or black swan events).
- False signals in low liquidity periods or thin markets.
- Over-optimization—cluttered screens, too many indicators, paralyzing indecision.
These aren’t reasons to abandon the strategy—but reminders to stay lean, alert, and remember it’s humanly imperfect.
Conclusion
BTC/USDT trading isn’t a magic trick—it’s a disciplined dance. By aligning with established trends, waiting for thoughtful pullbacks, and marrying technicals with real-world context, you set the stage. Add risk-managed entries, strategic exits (or trailing stops), and an emotional awareness that admits human error—and you’re not just trading, you’re navigating. Success comes from structure, agility, and knowing when to pause, adapt, or ride the wave.
FAQs
What timeframes work best for this BTC/USDT strategy?
The strategy uses higher timeframes—like daily and 4-hour charts—for trend alignment and retracement setups. These better reflect market structure and reduce noise compared to shorter timeframes.
How much should I risk per trade in this approach?
It’s wise to risk only a small percent—typically 1–2% of your total account per trade. That helps preserve capital through inevitable drawdowns and keeps emotional pressure manageable.
Can I use fixed profit targets or should I always trail?
Both have merit. Fixed targets (e.g., 1:1 or 1.5:1 reward-to-risk) offer clarity, while trailing stops (like using the EMA or swing structure) let profits run. Choose depending on your style and what's happening in the market.
What indicators truly matter here?
Stick to essentials: EMAs for trend, Fibonacci for retracement, ATR for sizing, plus volume or order book awareness. Avoid overcrowded charts; clarity matters more than complexity.
How do I manage unexpected price spikes or news events?
Stay aware of macro triggers—on-chain alerts, regulatory updates, or large withdrawals. If price breaks structure meaningfully, tighten stops or exit. Your strategy and adaptability go hand in hand.
Is this strategy suitable for all traders?
This framework suits intermediate to advanced traders who can read charts, manage risk, and handle emotional swings. Beginners should back-test or paper-trade before risking real capital.


Leave a comment